Для анализа ценовых движений существует множество методик. Но график является наглядным и самым простым из них. Для того чтобы подробно анализировать ценовые колебания можно использовать различные типы графиков. Структура для них является определяющей. На оси абсцисс или горизонтальной оси отмечается временный интервал, на оси ординат или вертикальной – отмечаются ценовые изменения.
При анализе ценовых изменений принято использовать графики под названием «чарты» (от слова «chart»). На чартах временным интервалом может выступать период от минуты до года.
Виды чартов
Есть такие виды чартов, которые обычно применяются во время анализа динамики цен:
- Тиковый;
- Бары;
- Линейный;
- Японские свечи.
Тиковый
Тиковые графики (от слова «Tick») лучшие всего подходят, если нужно получить наглядные данные значений отдельных котировок. Его главным отличием от других типов графиков является отсутствие обычной оси абсцисс. На нём точки перемещаются на отдельное значение по оси ординат (цен) и на определённый стандартный шаг по временной оси.
На активном рынке обычно можно заметить огромное количество ценовых изменений. Это будет отображаться на графике в виде большого количества тиков. А вот на неактивном рынке присутствует лишь ограниченное число тиков.
Бары
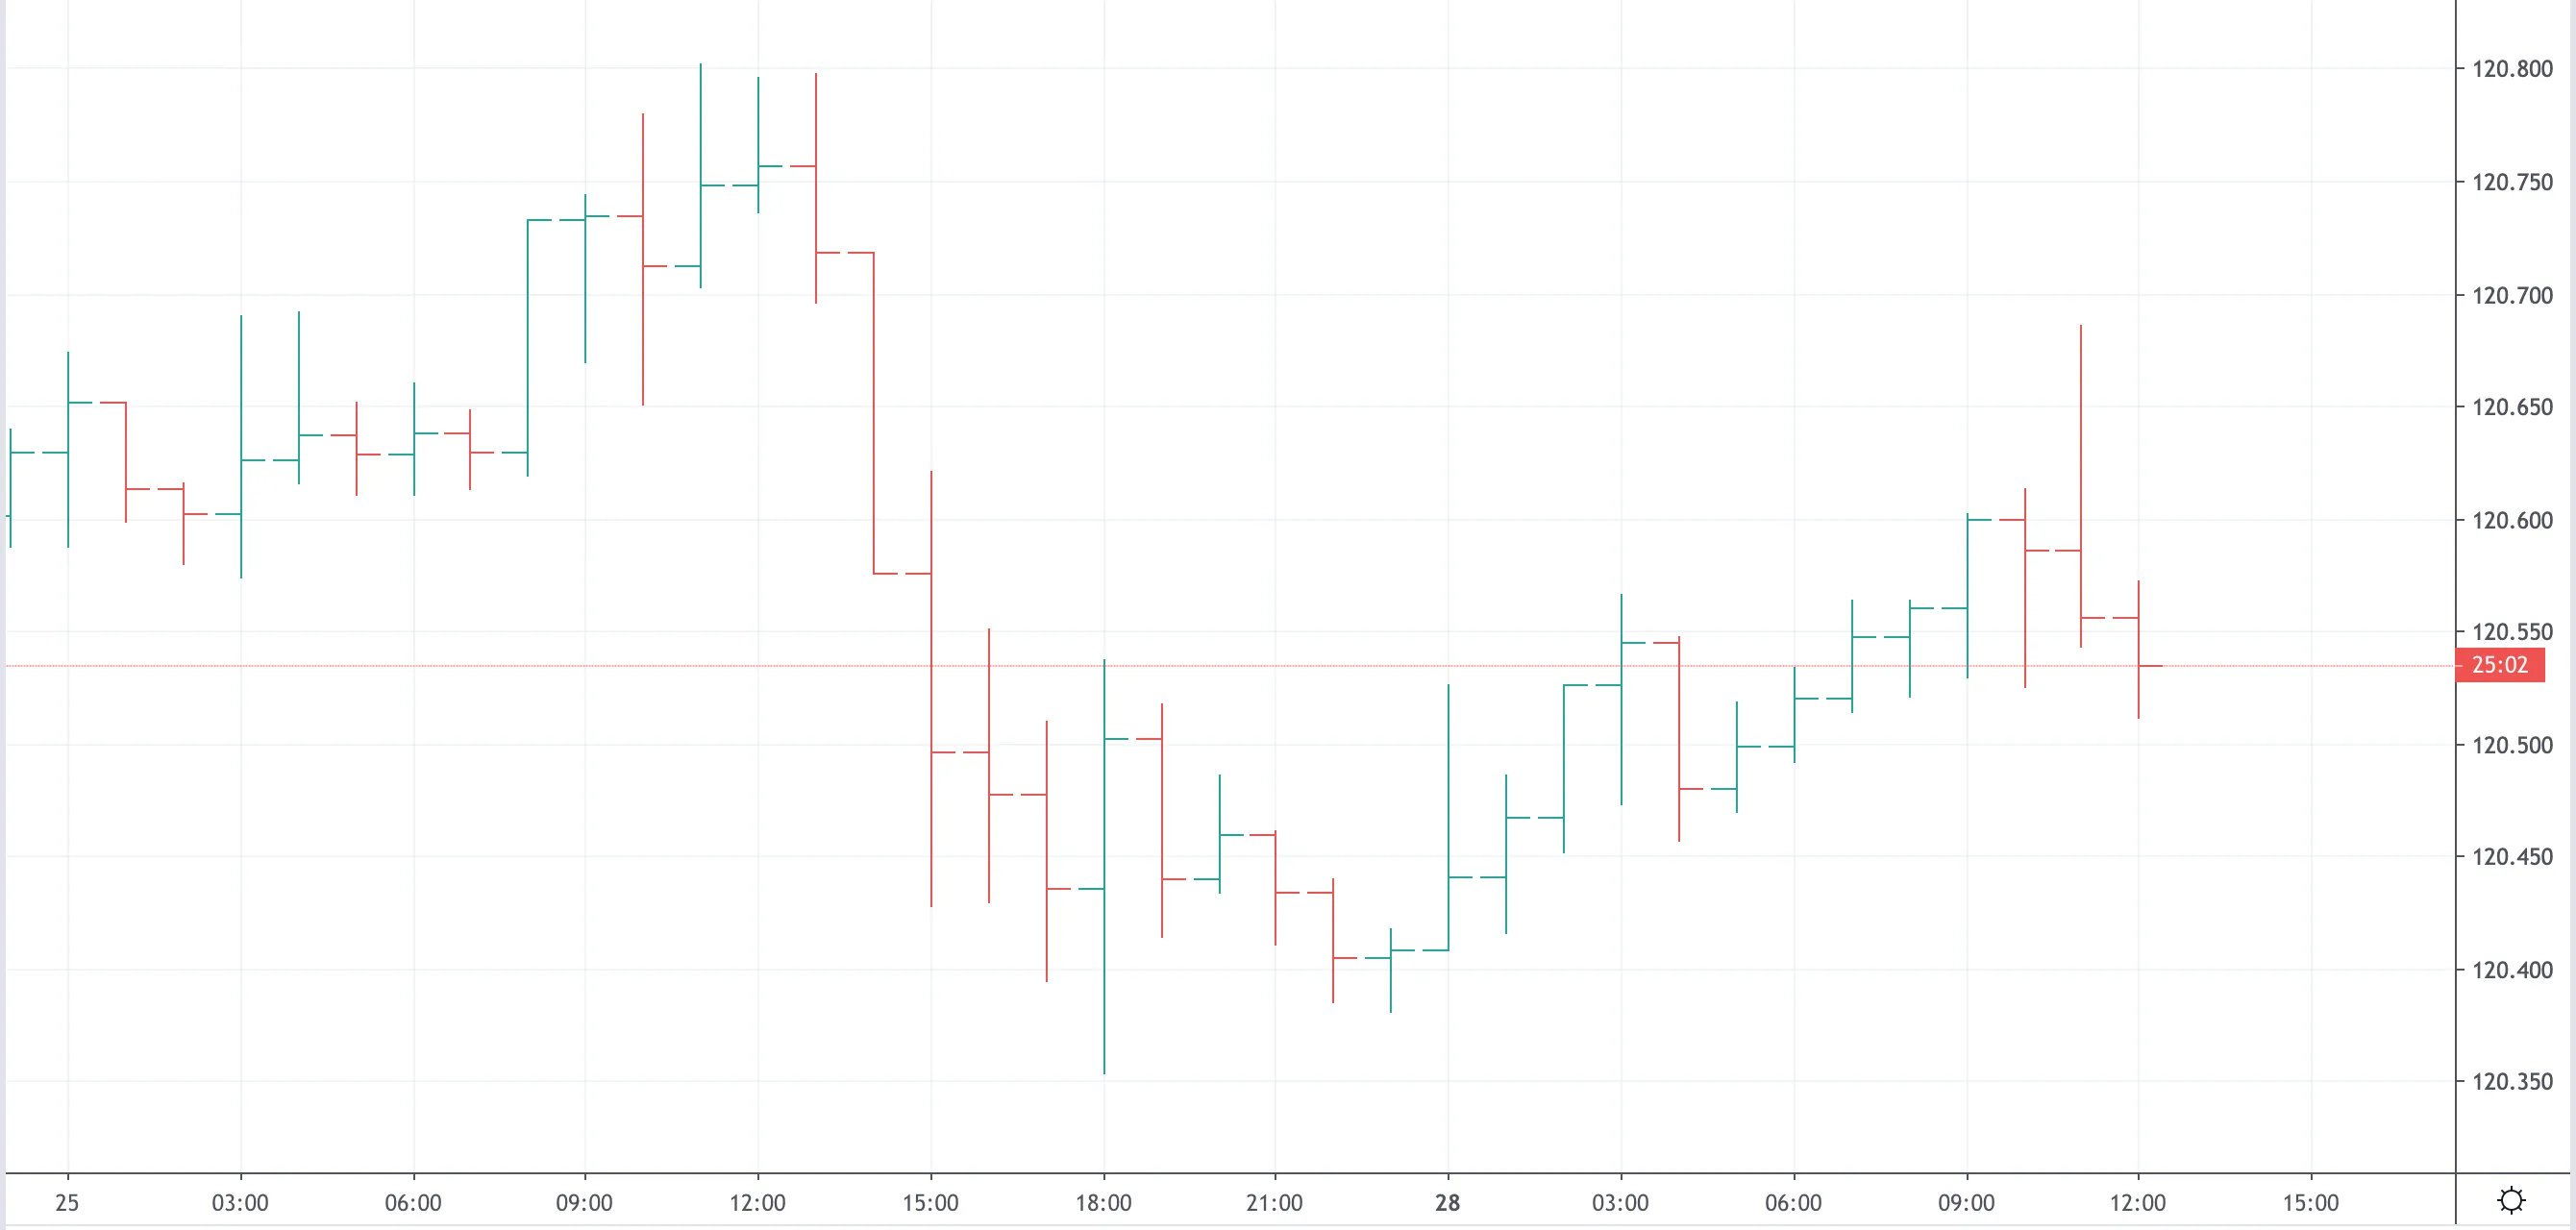
Наиболее распространённый тип графиков на площадках Европы – барный (Bar chart). Во многих случаях его называют столбцовым, палочковым графиком или гистограммой. Данный график отличается своей простотой, столбцы на нём показывают изменение цены. Самые важные данные, фиксирующиеся в точках на таком графике:

- Low и High (самая низкая и высокая цена соответственно) за определённое время. Эти показатели должны быть соединены вертикальной линией после того, как они будут определены и отображены на графике.
- Open (цена открытия). Для того чтобы её отметить, служит маленькая горизонтальная линия справа налево.
- Close (цена закрытия). Для того чтобы ей отметить, служит маленькая горизонтальная линия слева направо.
Если цена открытия находится на большом расстоянии от цены закрытия предыдущего бара, это явление называют разрывом (гепом). То есть под гепом подразумевается разрыв экстремального уровня цен предыдущих и текущих торгов. Так, стоимость открытия имеет важную роль, когда она выше цены закрытия предыдущей сессии в то время, когда на рынке наблюдается восходящий тренд и когда она ниже цен прошлой сессии – когда на рынке наблюдается нисходящий тренд.
Бары дают возможность увидеть все цены в отдельном временном интервале. При этом самый популярный интервал – дневной, реже – недельный. Хоть и данные временные промежутки отображается точнее, в столбцовых графиках вполне можно использовать и другие периоды.
Но бары имеют один минус – неравномерность ценовых колебаний не учитывается ею. Этого можно избежать при использовании столбцов различной толщины. Но на глаз график будет восприниматься сложнее. Понятность ещё зависит от длинны временного интервала.
Линейный график
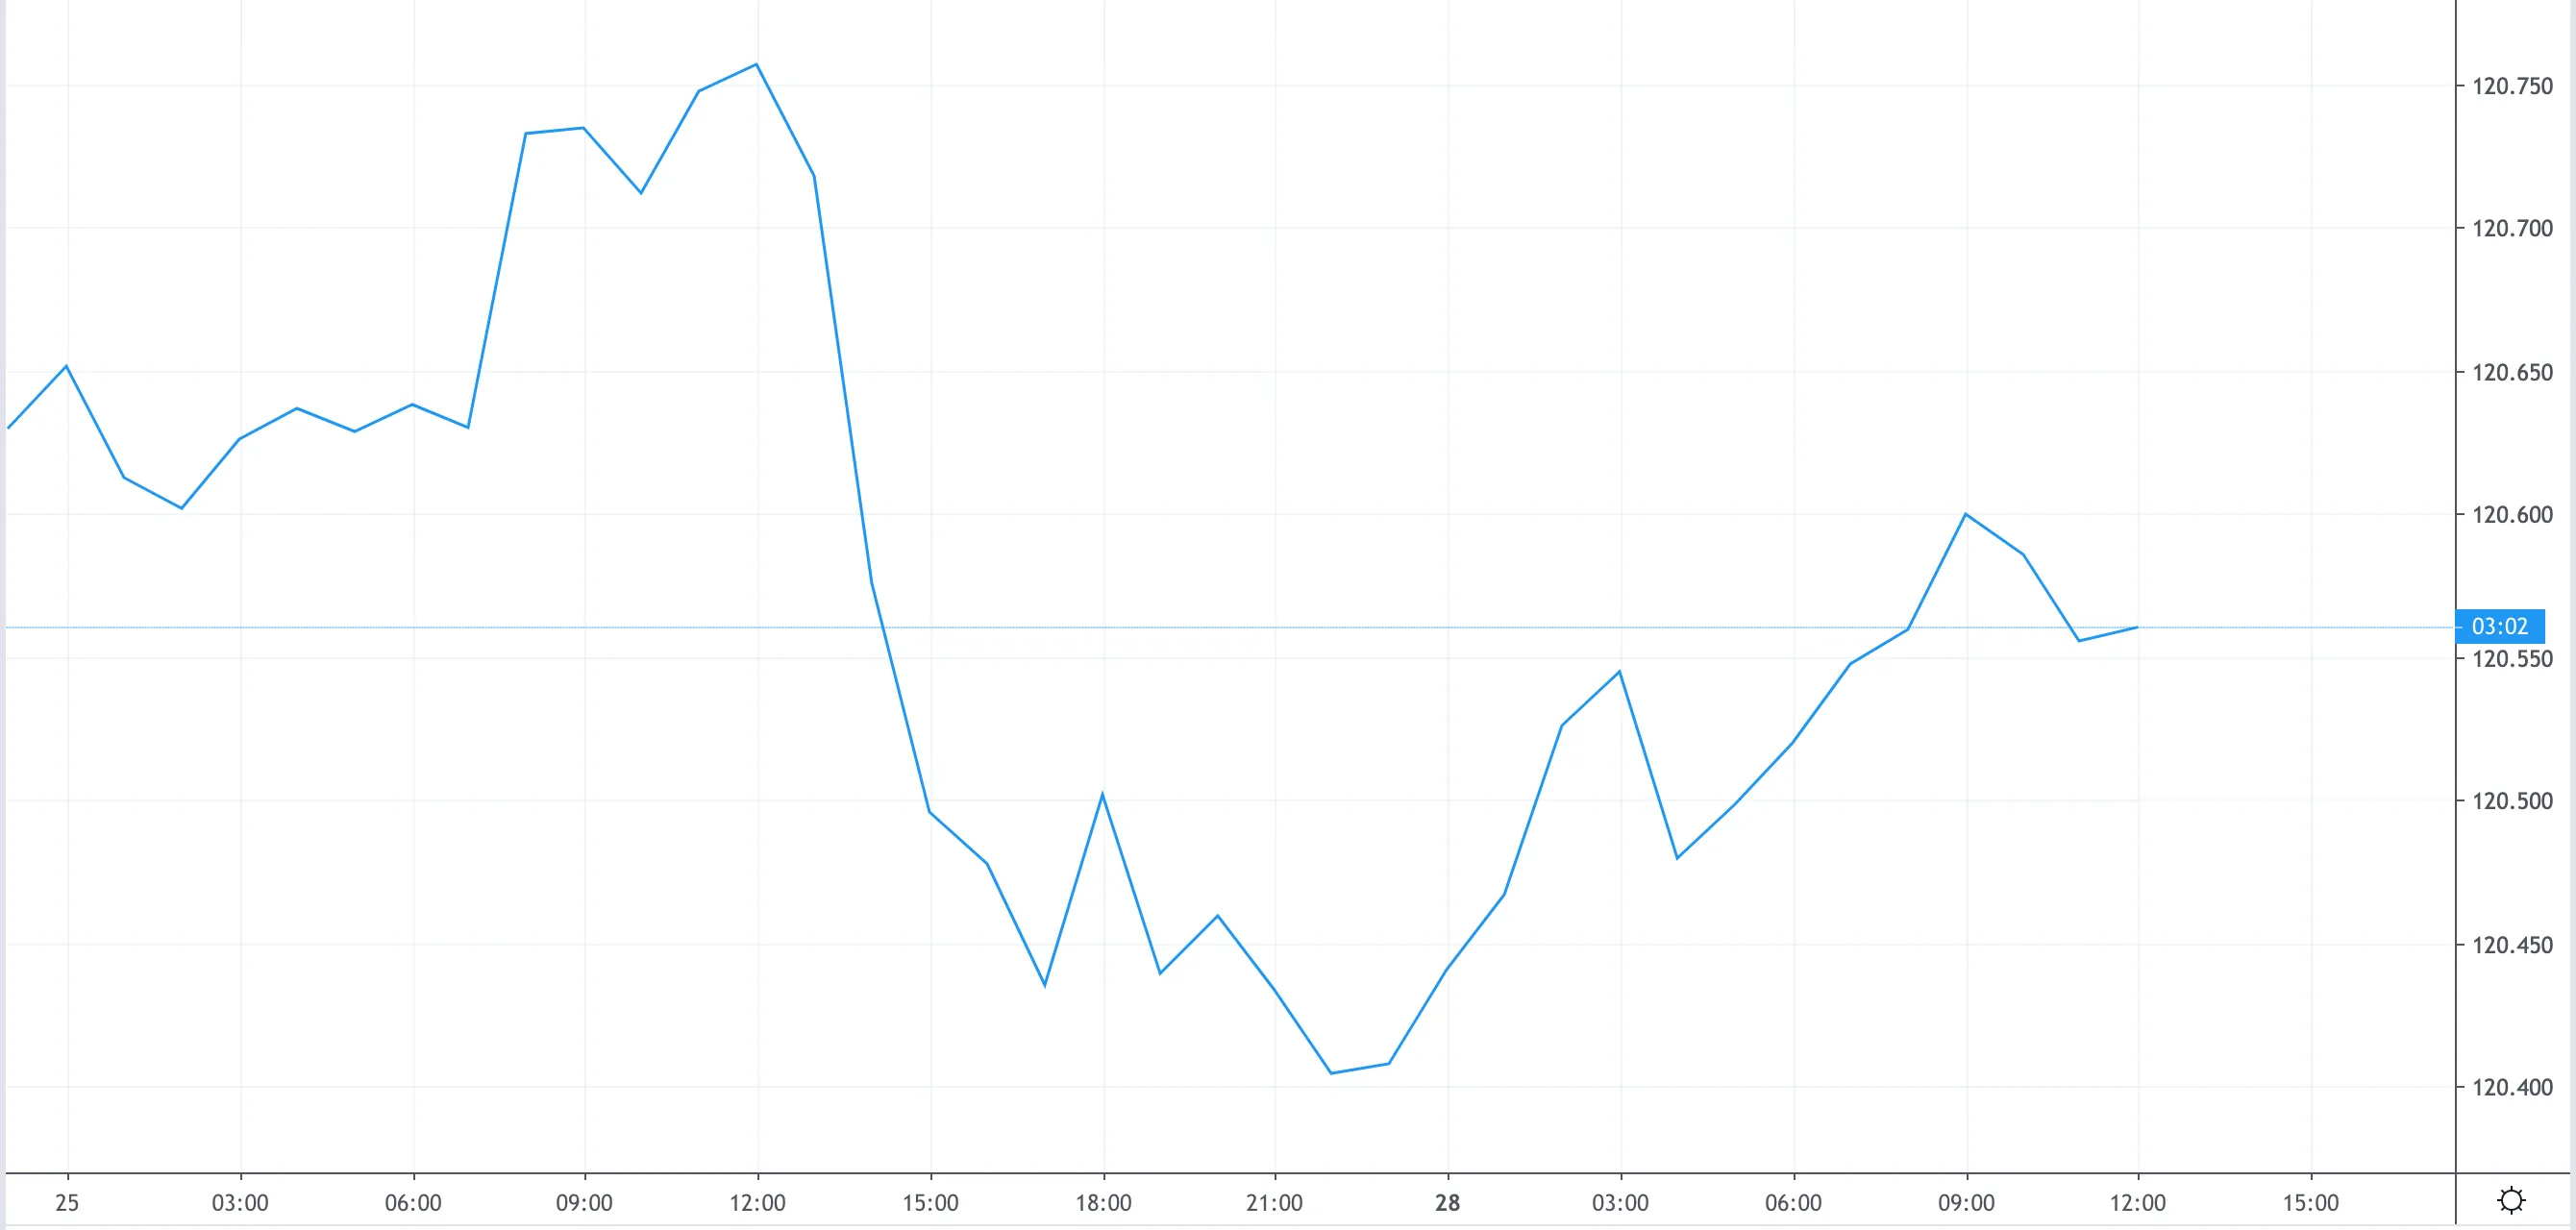
Line Chart при анализе используется сугубо индивидуально. Он не способен отразить все данные движения стоимости на протяжении суток. Но в то же время при малом количестве данных или рыночной пассивности он удобен.
Точки показывают цену закрытия в отдельном временном интервале и по ним строится линейный график. Их соединяют линиями, а если увеличить масштаб, то данный график выглядит как плавная кривая.

Японские свечи
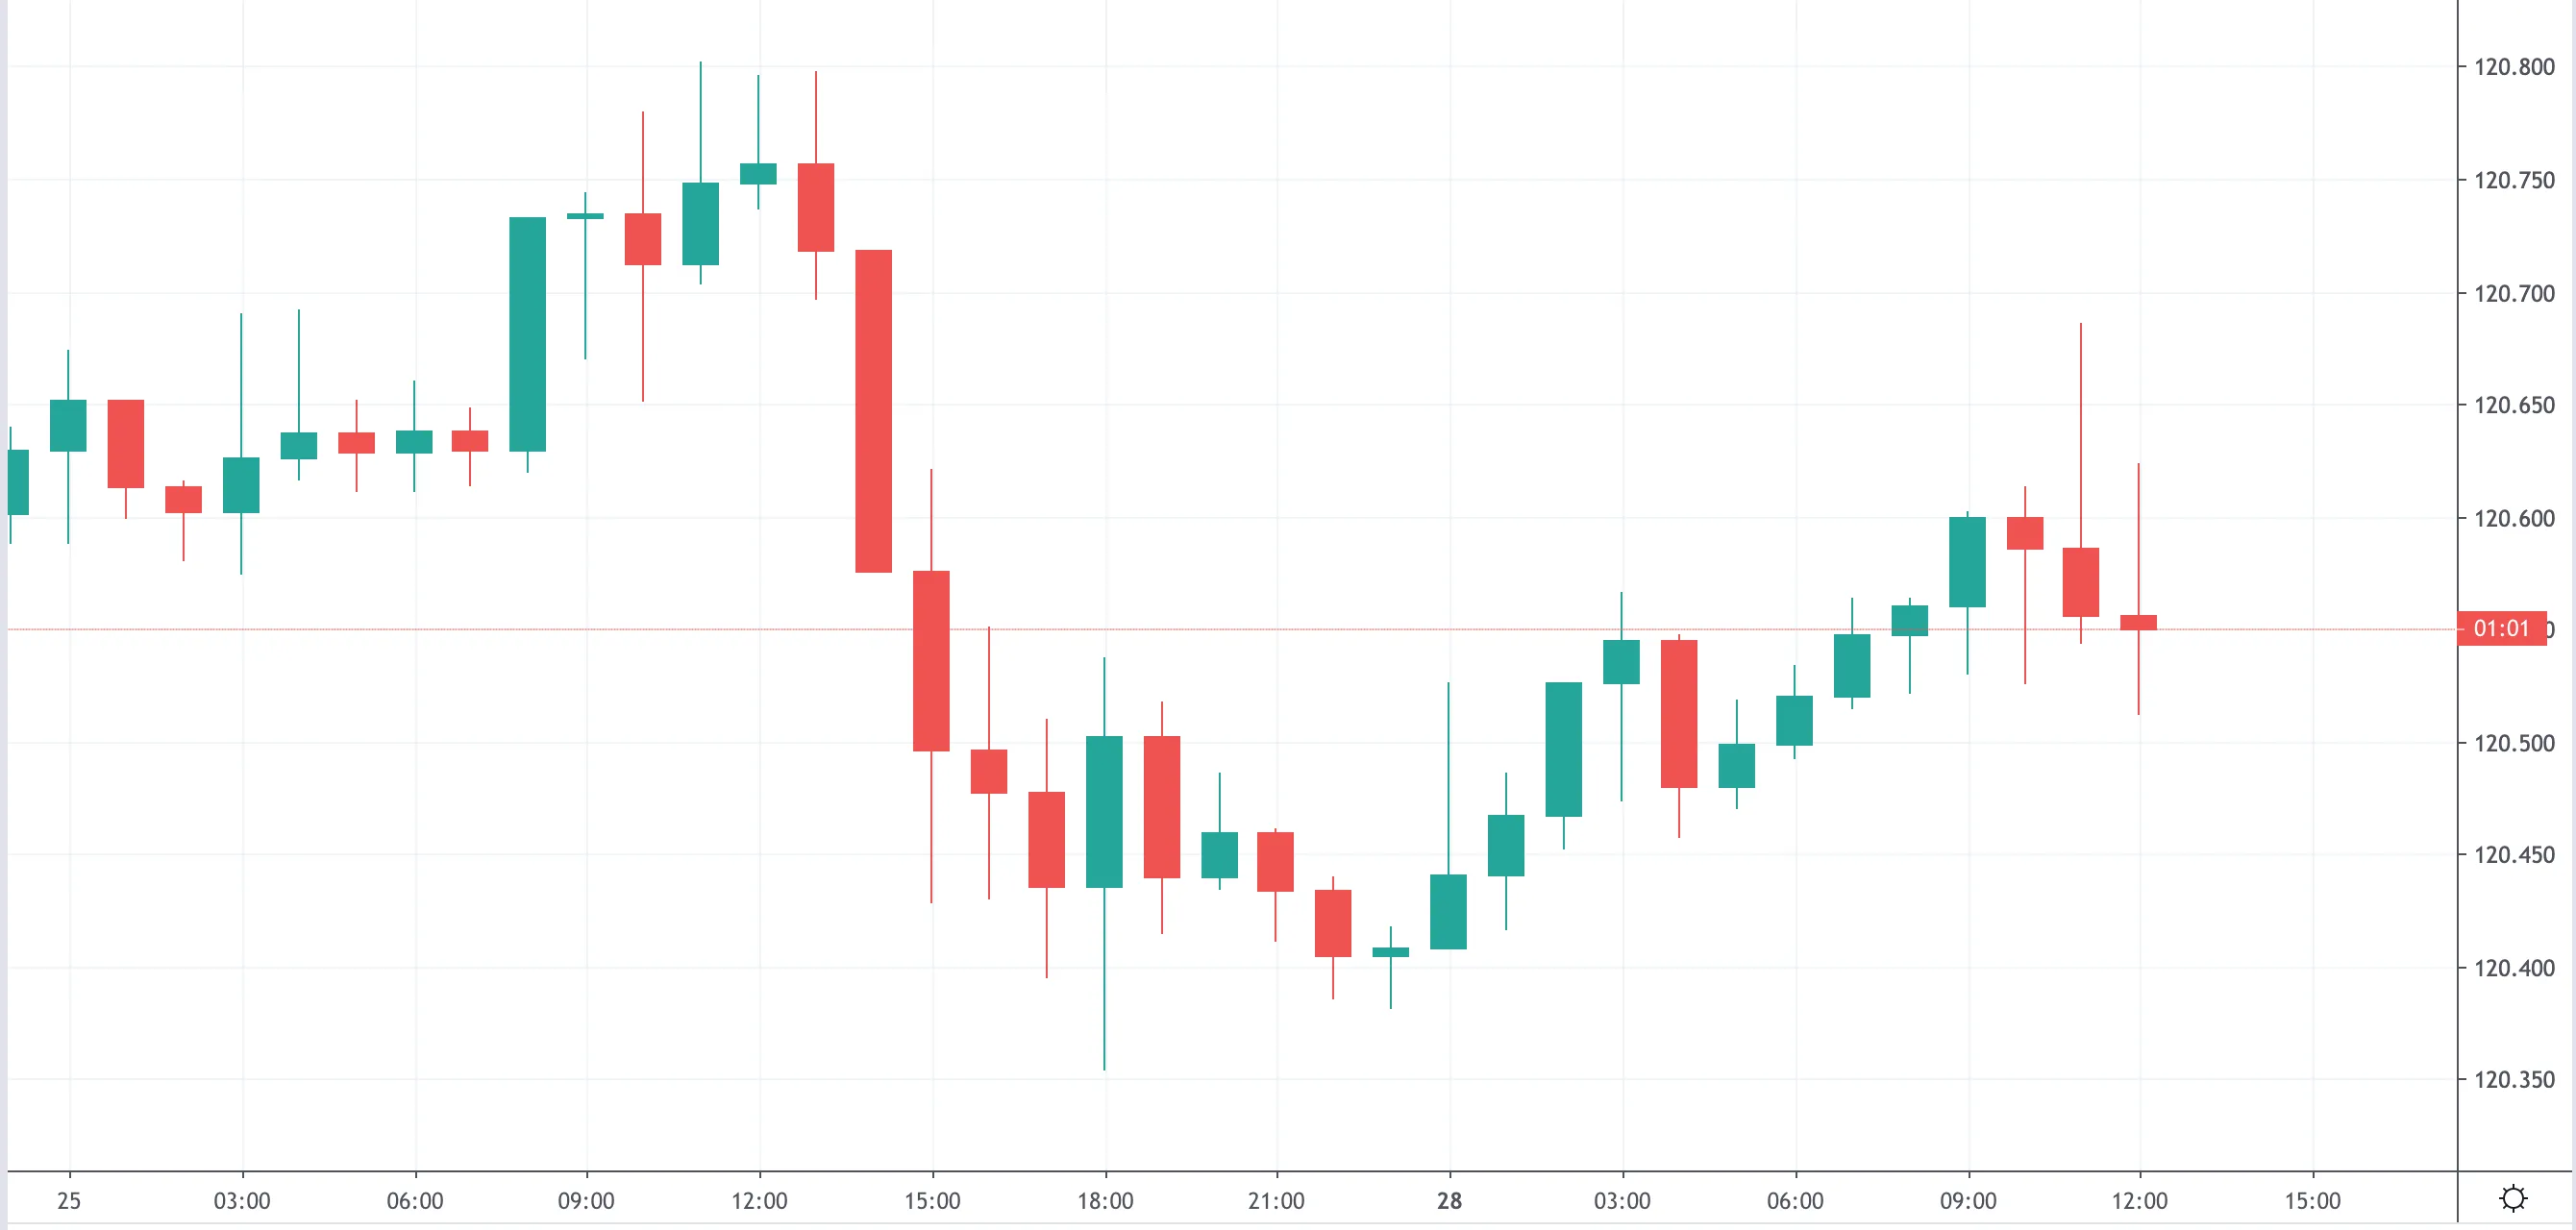
Ну а самым обширным и информативным типом графиков являются японские свечи (Candle Stick или Подсвечники). Данный график похож на столбцовый тем, что использует те самые 4 главные цены. Но японские свечи очень легко воспринимать, благодаря их особенностям и удобству. Множество трейдеров говорят о данном графике, как об идеальном для технического анализа ценового движения.
Разные комбинации данных помогают по-разному интерпретировать графики. Аналитики с опытом умеют определять и прогнозировать направление по цене. Им в этом помогают внешний вид свеч и главные индикаторы.

Структура японской свечи очень интересна и необычна. В ней присутствуют тонкие и толстые линии. Толстая линия ещё называется джиттай (тело). Тело – это разница между ценой открытия и ценой закрытия торговой сессии. А разница определяется по цвету данного тела. Тело будет зелёным, если цена закрытия оказалась выше. Если же динамика является обратно, а цена открытия при этом выше, то тело окрашивается в красный цвет. Поэтому красный цвет называют цветом «быков», а зелёный – «медведей».
Кроме этого, на графике есть и тонкие линии, которые размещаются вокруг тела. Они означают экстремальные значения дня торгов. Их называют тенями. Тени выше тела называют верхними (увакаге), а тени ниже тела называются нижними (шитакаге). Минимальное значение цены определяется нижними тенями, а максимальное – верхними. Японцы часто называют нижние тени хвостом, а верхние – волосами.
Главным отличием японских свечей и баров является привлекательность и удобство. Это помогает при быстром обзоре торгового дня и анализе данных. Поэтому практичность и особенность японских свечей выделяет их на фоне остальных графиков.
