Тренды – это основа биржевой торговли. Любой трейдер должен уметь строить трендовые уровни и линии и торговать, опираясь на них. В этой статье вы узнаете всю информацию, которая необходима новичку, чтобы разобраться во всех тонкостях трендов.
Что такое тренд
Трендом называется движение цены в одном направлении, которое действует на протяжении определённого времени. То есть, это отдельный участок падения или роста стоимости, который можно визуально определить по графику.
Тренды помогают трейдеру:
- Создавать торговые стратегии самому;
- Прогнозировать изменение цены актива;
- Качественно использовать индикаторы на бирже.
Типы трендов
Классификация трендов производится по главным критериям – время существования и направленность. Далее вы подробнее узнаете о каждом из них. По направленности тренды бывают:
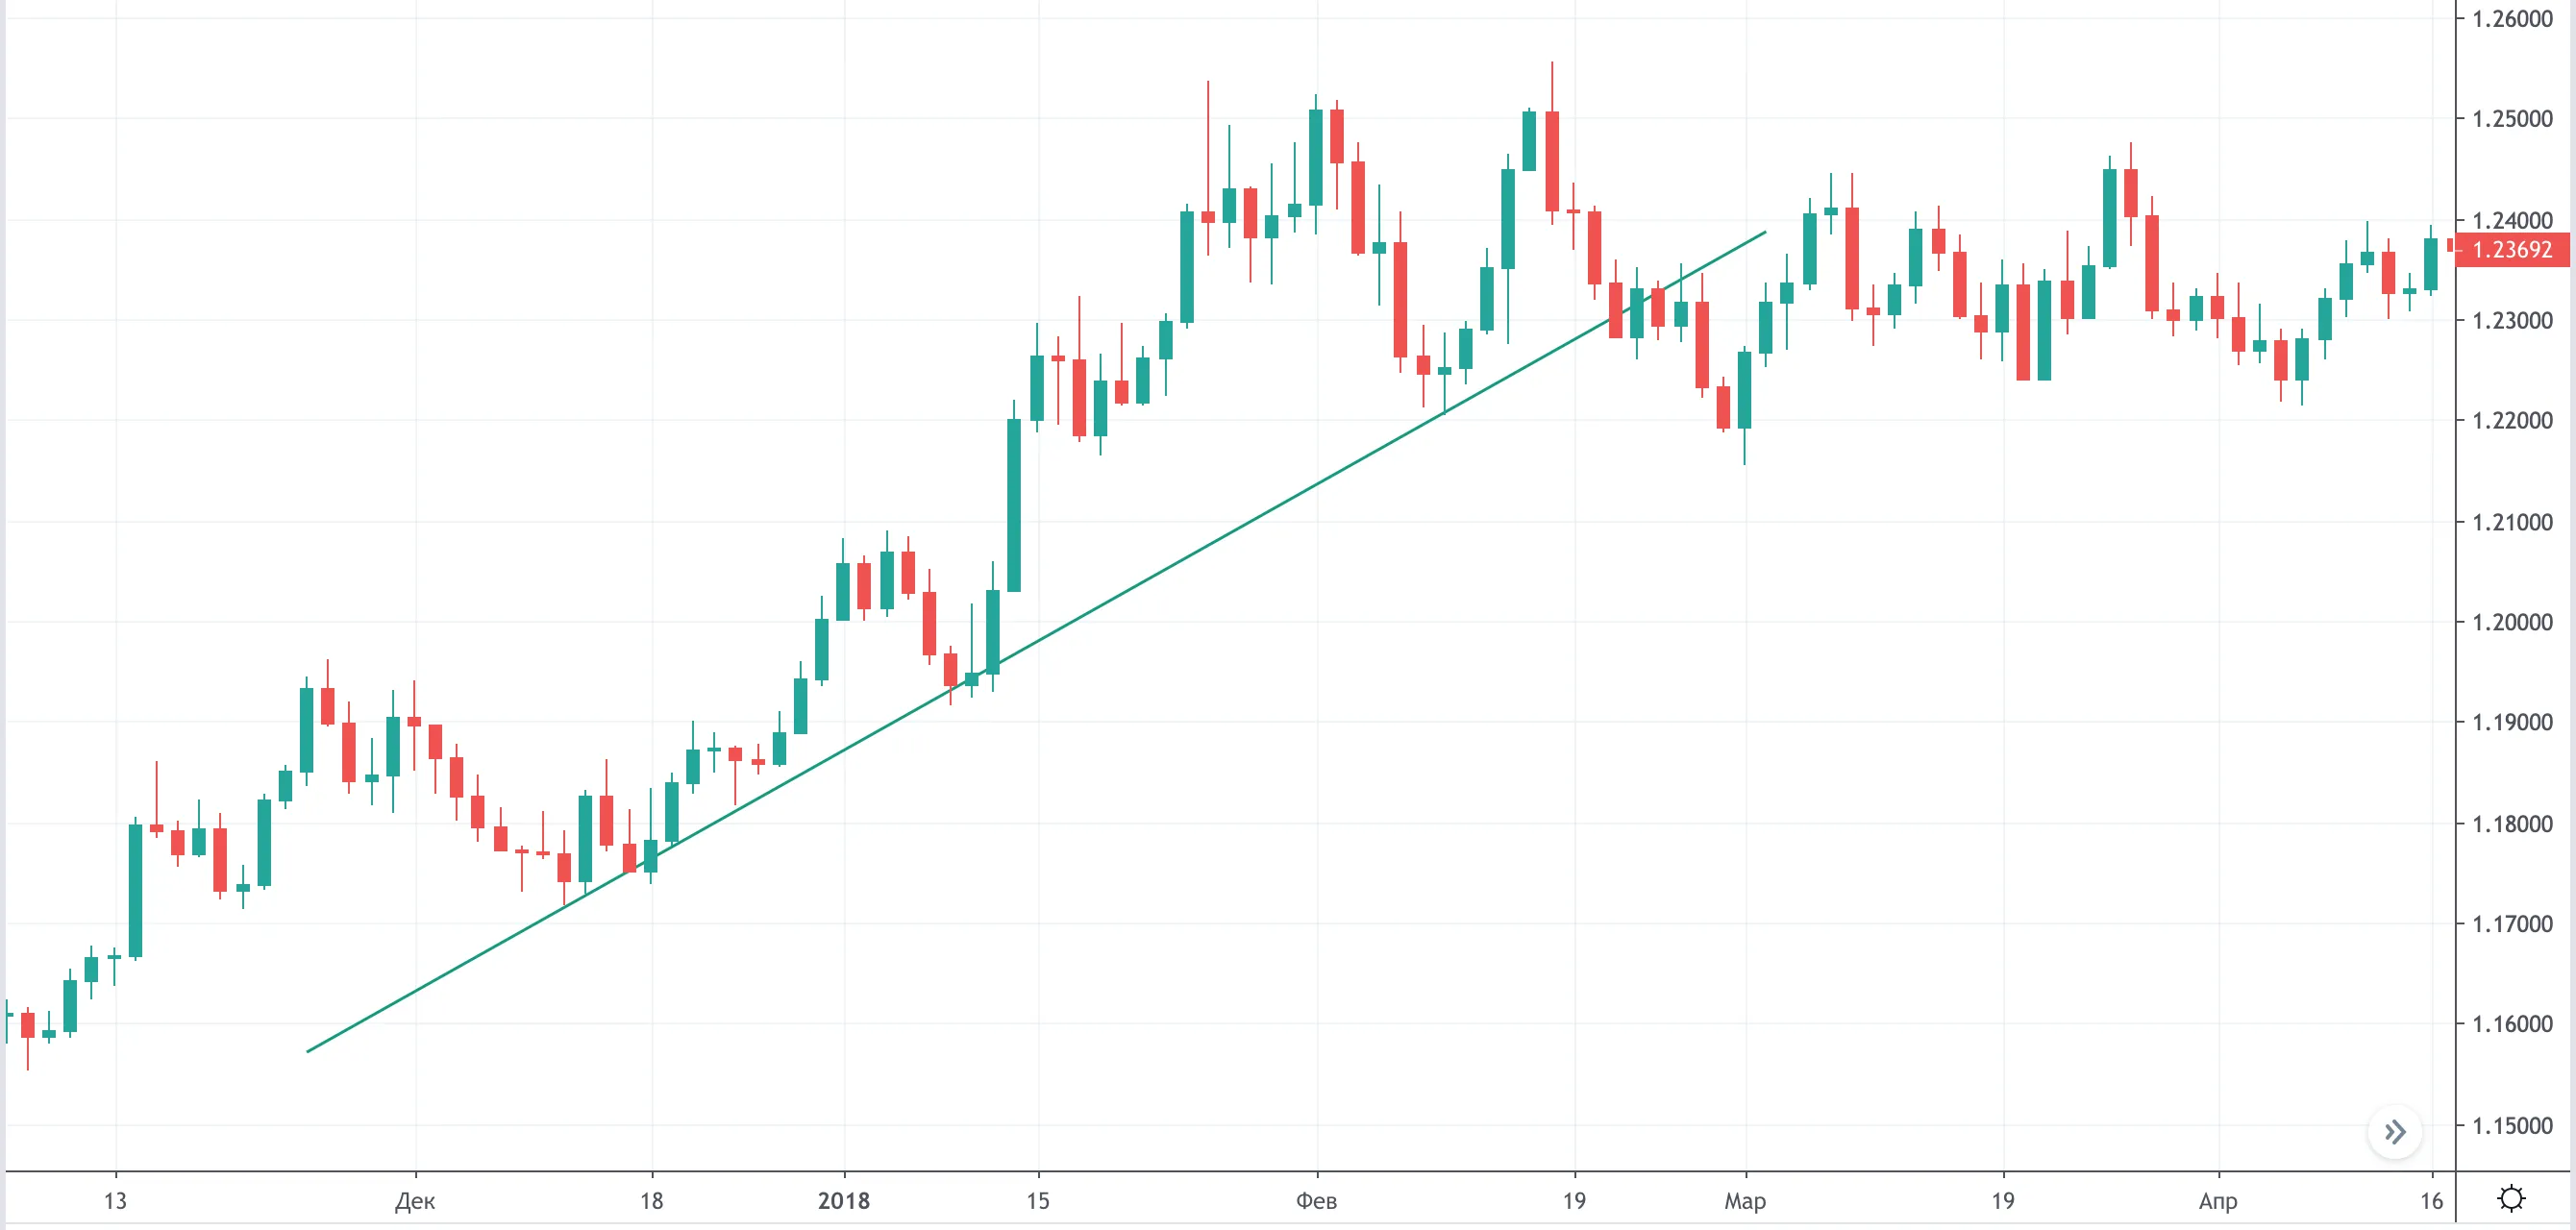
- Бычьи (восходящие). На графике каждый следующий минимум и максимум (пик) должен находиться выше прошлых

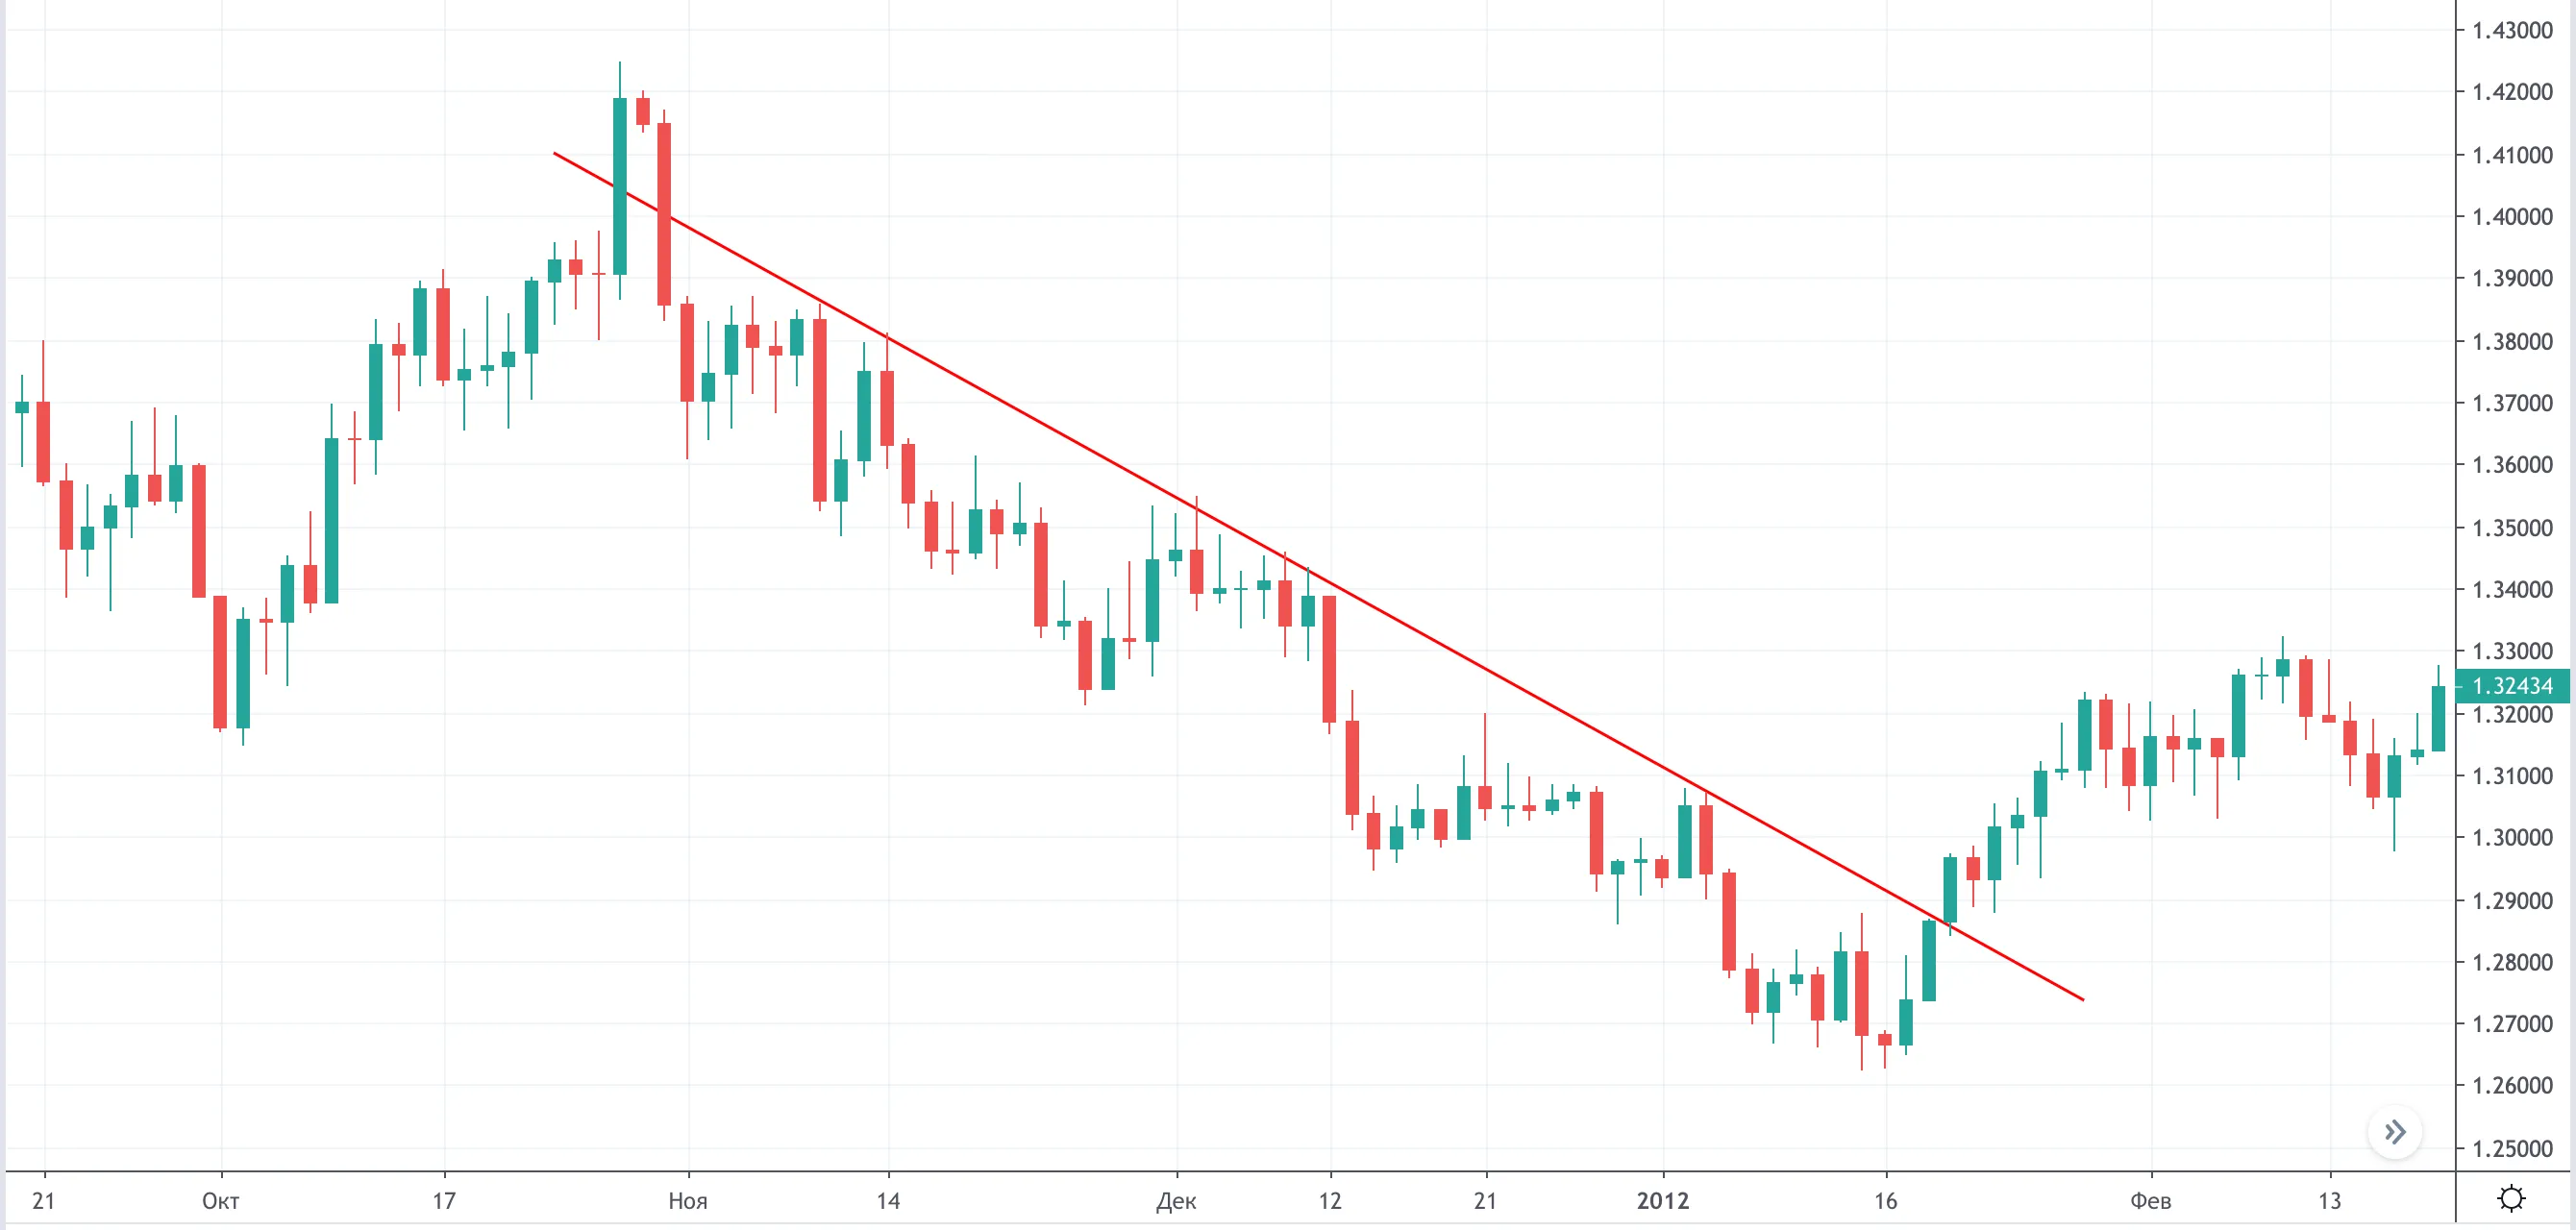
- Медвежьи (нисходящие). На графике есть понижающиеся максимумы и минимумы, которые следуют по очереди один за другим. Каждая из последующих точек будет ниже прошлой:

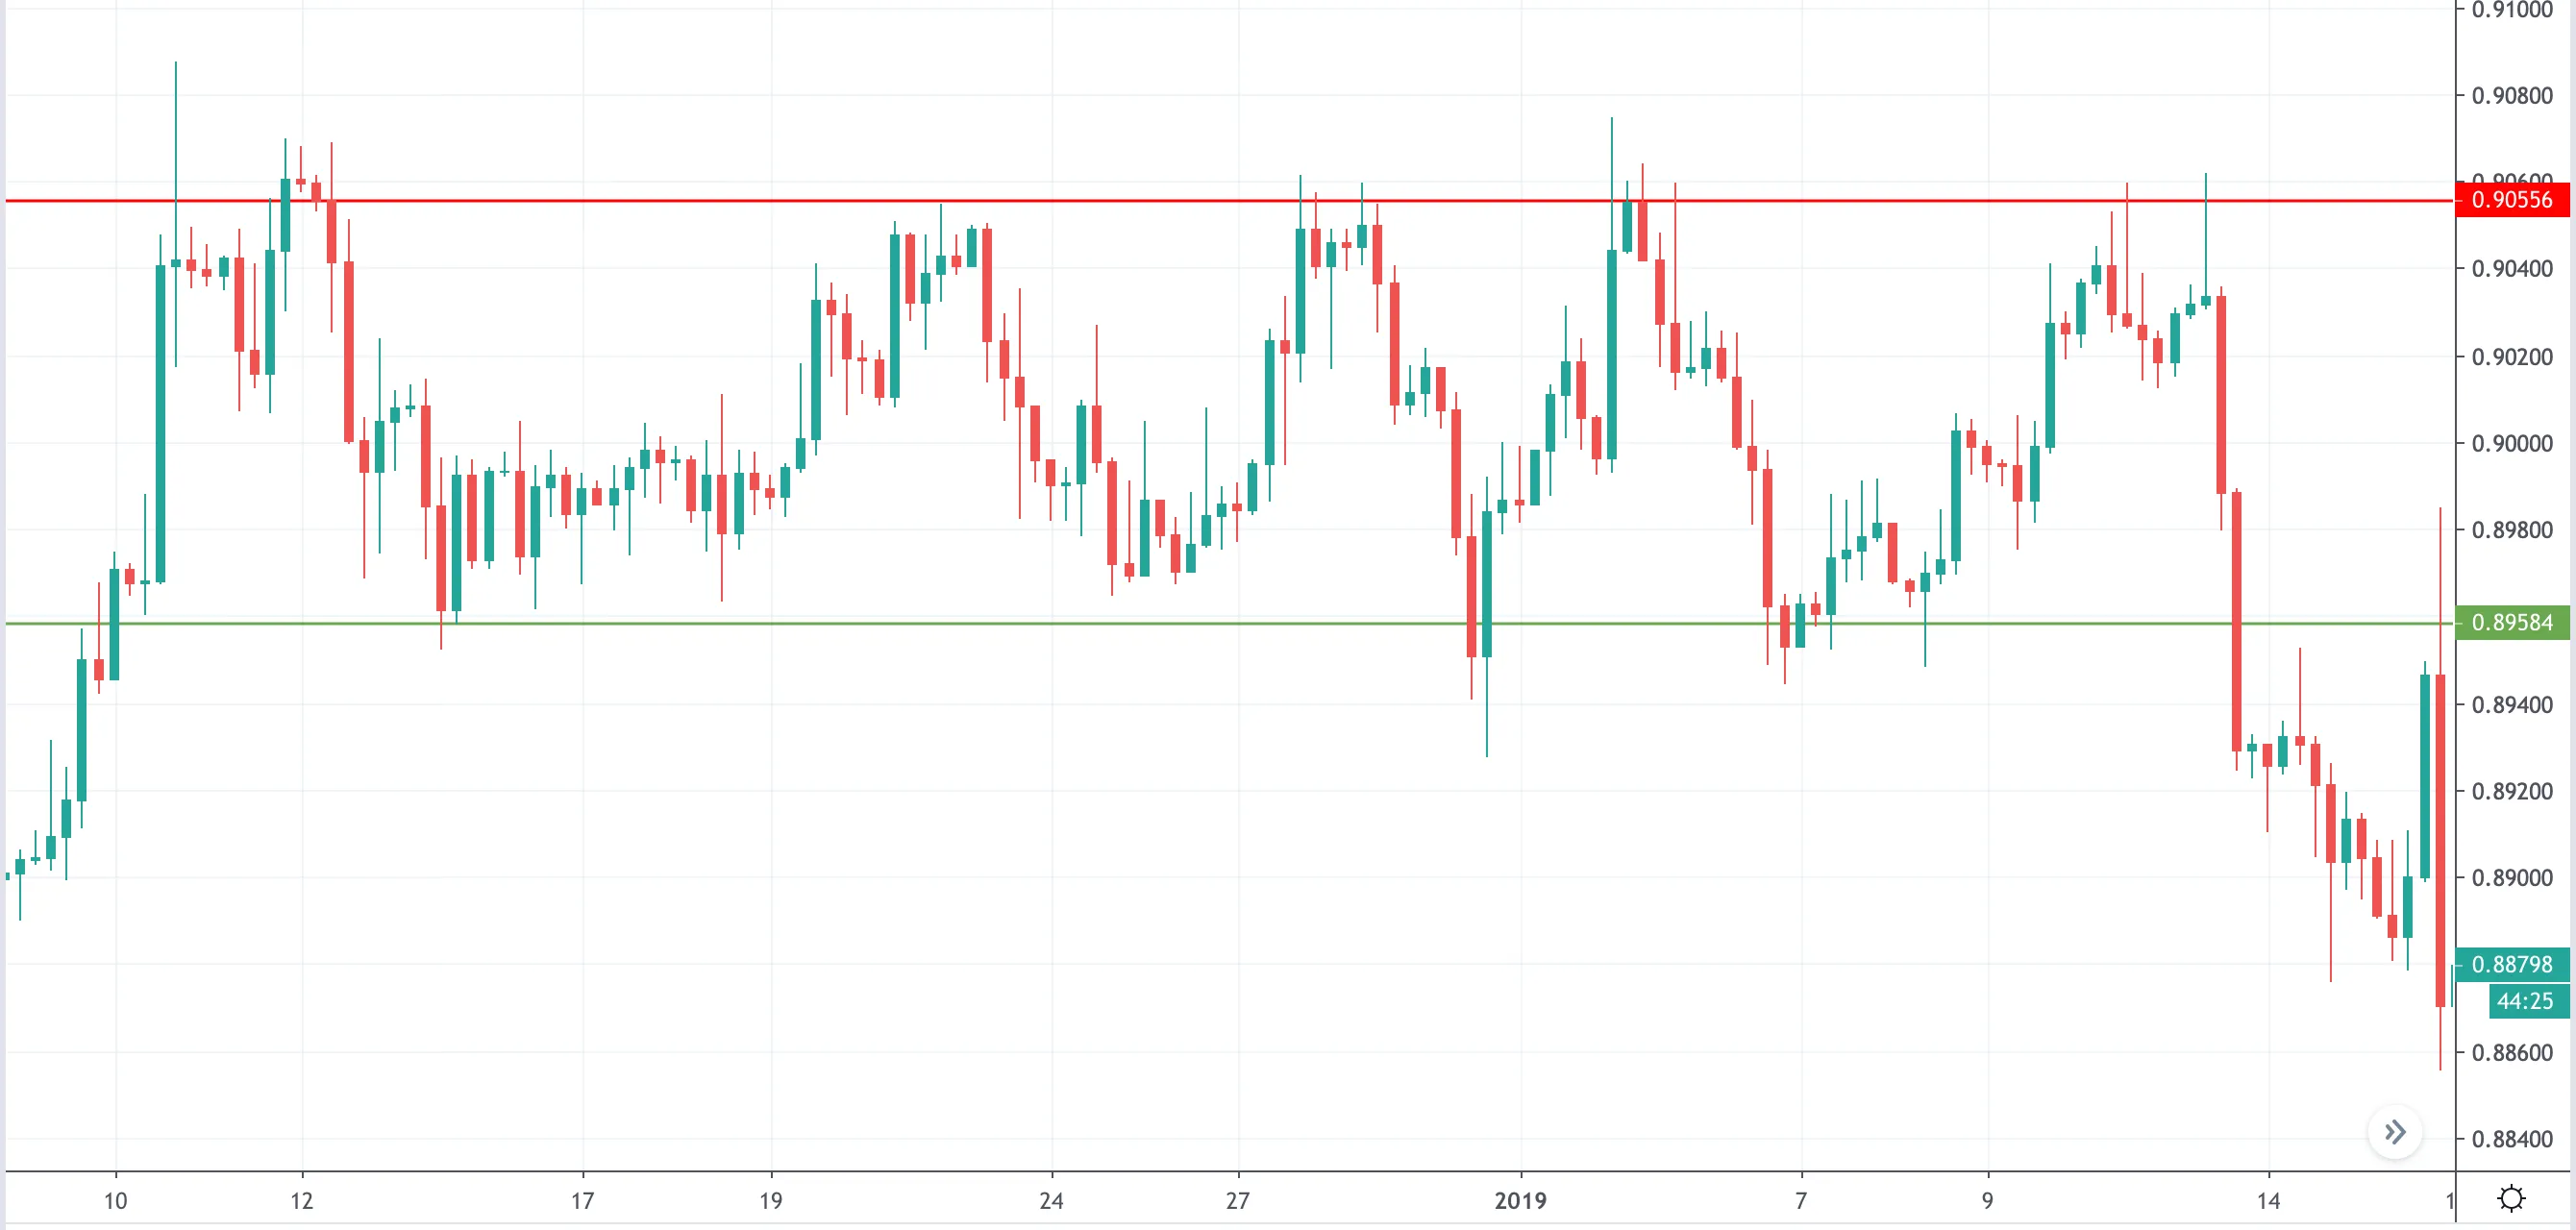
- Флэт (боковые). На графике данная цена движется без видимого направления. Минимумы и максимумы будут находиться почти на одном уровне. Трейдеры допускают, что тренд отсутствует, когда присутствует флэт. Но это допущение неправильное, тренд всегда существует на рынке, но его нужно правильно определить.

По времени существования тренды делятся на:
- Краткосрочные. Это тенденции, которые обычно зависят от множества событий (и случайных тоже). Они часто не поддаются техническому анализу. Их составляют маленькие колебания. Обычно идут вразрез со следующим типом трендов (среднесрочными). Длительность обычно составляет от 1 недели до 1 месяца.
- Среднесрочные (промежуточные или вторичные). Длительность от 1 месяца до 0.5 года. Данные тенденции считаются коррекционными и идут вразрез со следующим типом трендов (долгосрочные).
- Долгосрочные (основные или первичные). Длительность от 1 до 2 лет. На них обычно торгуют крупные инвесторы и игроки на рынке.
Никакой долгосрочный тренд не будет начинаться или заканчиваться неожиданно. Обычно тенденции развиваются по одинаковому сценарию.
Вот вы и узнали о трендах рынка. Но есть и другая важная особенность – это фазы тренда.
Когда начинается первая фаза (накопления), то крупные игроки и инвесторы начинают продавать и покупать финансовые активы.
Когда начинается фаза распределения, то на рынке появляются другие участники, после чего начинают появляться долгие движения (импульсные) и короткие (коррекционные).
Когда начинается последняя фаза, то цена доходит до максимума. В такой момент крупные инвесторы и игроки фиксируют позиции и выводят средства.
Как строить линию тренда
Линией тренда называется универсальный инструмент для технического анализа, благодаря которому можно определить направление рынка. Также он помогает определить силу текущего тренда, вероятность изменения направления ценового движения и время данного изменения. Мало будет знать лишь значение тренда, чтобы провести трендовую линию. Трейдер должен знать и главные правила построения, чтобы разобраться в теме.
Нужно выделять не все минимумы и максимумы, а лишь самые главные. Для восходящего тренда линию можно построить по 2 самым главным минимумам (уровням поддержки), а для нисходящего – по 2 максимумам (уровням сопротивления). Также необходимо точно выбрать опорные точки для того, чтобы точно построить линии тренда. Универсального алгоритма тут нет, поэтому сейчас вы сможете узнать один из самых лучших.
Для первой точки лучше всего выбрать самый высокий максимум или самый низкий минимум. Всё будет зависеть от тренда, который анализируется.
Второй же точкой будет соседняя с первым максимумом или минимумом. Здесь через определённый промежуток времени случится пробой трендовой линии, и вы сможете провести новую.
А вот способов построения трендовых линий два: по теням свечей и по телам. Вы сами будете решать, какой именно выбирать, они оба верны. Но вы должны будете всегда придерживаться выбранного способа. В случае использования трендовой линии в качестве уровня поддержки стоит фиксировать продажи или покупать. В случае использования трендовой линии в качестве уровня сопротивления стоит фиксировать покупки или продавать.
Теперь вы узнали главное о трендах на фондовой бирже и построении трендовых линий. Дальше стоит использовать свои знания на практике и получать бесценный опыт.
