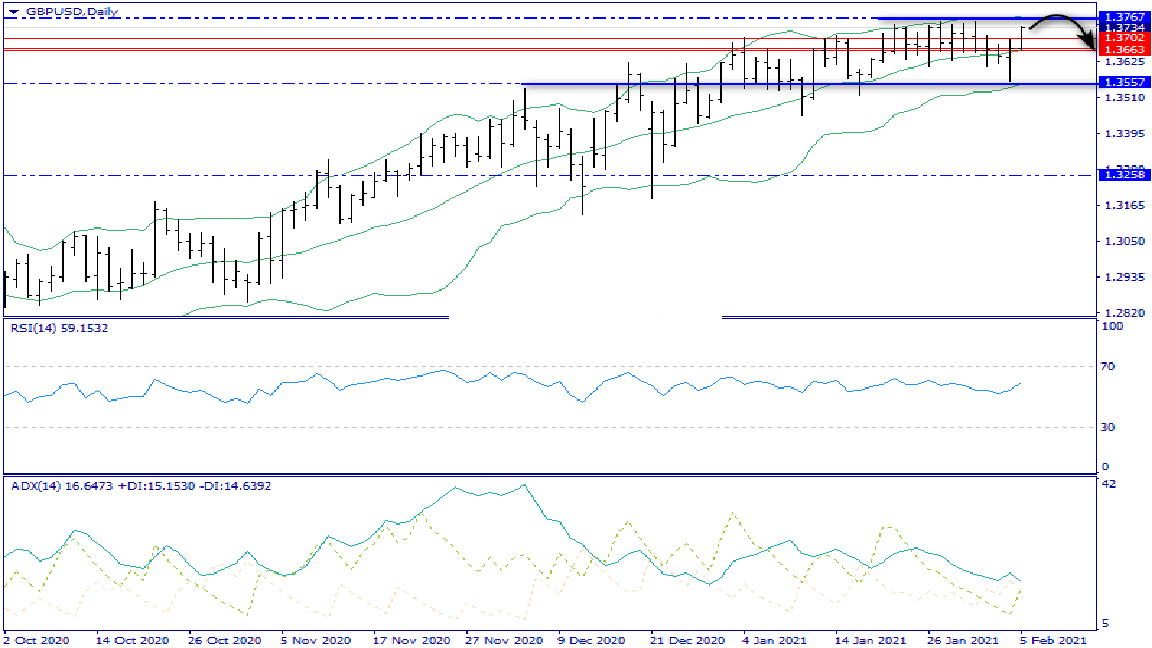
Daily chart: the growth of quotes comes against the background of the absence of trend activity from the ADX indicator. This reveals the probable lack of trend potential on the side of buyers, and accordingly, a high probability of a downward reversal from the resistance zone 1.3767 (upper Bollinger band + supply zone within the O&U pattern).
Н4: a very strong local area of resistance will also be met by bulls at levels 1.3750-1.3755. The local ADX is not in the trend zone, so the probability of a higher breakout is low. This makes the downward reversal scenario to be the main one.
Н1: the final bullish potential remains on the hourly chart, which allows trading upwards before testing the 1.3755-1.3767 zone.
Conclusions: growth to the 1.3755-1.3767 zone, then a downward reversal in the direction of 1.3663.
Trading solutions:
1. Buy to 1.3755-1.3767.
2. Selling from the 1.3755-1.3767 zone to 1.3663.