Like all charts, Japanese candlesticks display price movement over a specific period of time. However, unlike other methods, Japanese candlesticks present information in a more visual form. They will make it easier for you to determine market sentiments and perform chart analysis.
Japanese Candlestick Charts Contain More Information
When trading various instruments (currency, commodities, or stocks), you will constantly use price charts to analyze price movements in the market.
The line chart is the simplest way of displaying cost movements. In it, information is displayed through a regular line and sequential data. This chart is often found in newspapers and magazines dedicated to the stock market.
The Japanese candlestick chart also reflects price movement but consists of a greater number of elements. That’s why most traders use candlesticks in their trading.
Japanese Candlesticks Reflect Different Time Periods
If you set up the Japanese candlestick chart for a 30-minute period, then any candle will be formed within half an hour. Accordingly, if the chart is set for a 15-minute period, then each candle will be formed within a quarter of an hour.

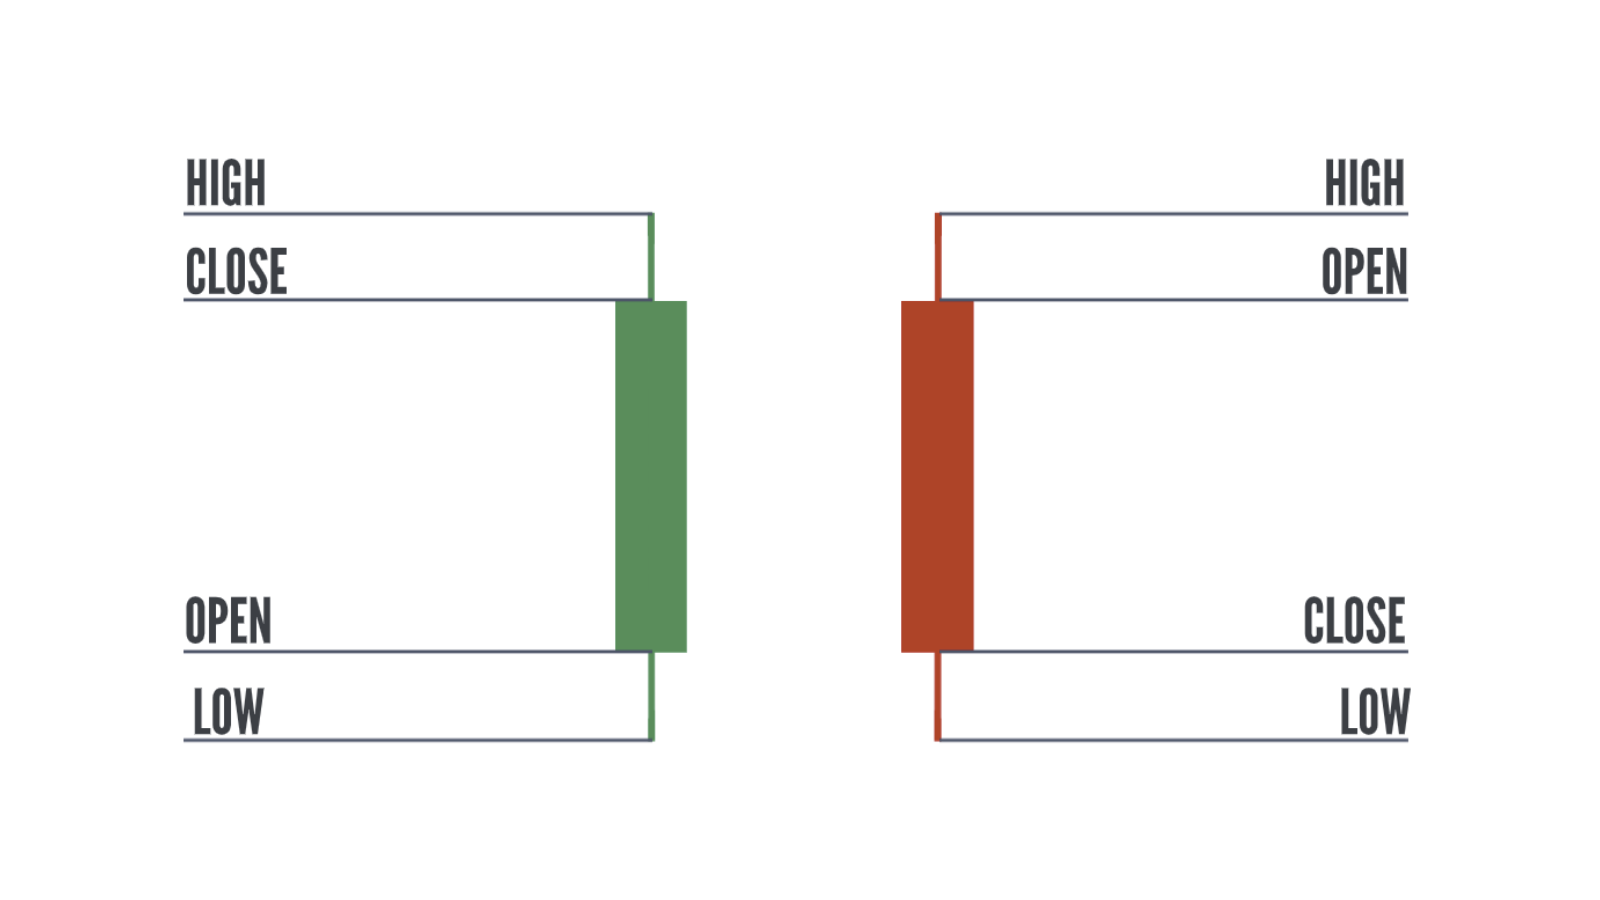
A single candle shows the closing and opening price, as well as the minimum and maximum price.
The wide part of the candle is its body. It shows the closing and opening level of the period. Therefore, if the chart is hourly, then the body of any candle will show the opening and closing price of this hourly period. Shadows at the bottom and top will show the maximum and minimum price for a 1-hour period. A chart where you can see the closing and opening price, the minimum, and the maximum cost for a separate period is called an OHLC chart.
The body’s color will show the type of candle – bearish (falling) or bullish (rising). Most often, bearish candles are marked in orange or red, and bullish candles are marked in blue or green.
If the candle is bullish, then the opening price will always be at the bottom, and the closing price will be at the top. If the candle is bearish, then the opening price will always be at the top, and the closing price will be at the bottom.
Different colors give you the ability to quickly identify the type of candle.
