To continue learning and developing as a trader, you will need to study the basic terminology of online trading and trader’s jargon. If you can’t learn all the terms right away, don’t be upset, as it’s impossible to do it all at once. You can return to this part of the course at any time when you come across an unfamiliar term.
Currency Pairs
Currency pairs will be the first thing you pay attention to when getting acquainted with the Forex market. The concept of the value of a commodity is not difficult to understand, because there is only one. For example, the cost of oil is the price of one barrel. For gold, it’s the price of one ounce. When it comes to Forex trading, 2 currencies are involved in forming the price. This is called a currency pair. The pairing confuses beginners, so we’ll figure out the term “currency pair” first. During Forex trading, we acquire one currency by exchanging it for another. For example, you don’t just buy the British pound, but exchange it for a certain amount of another currency. 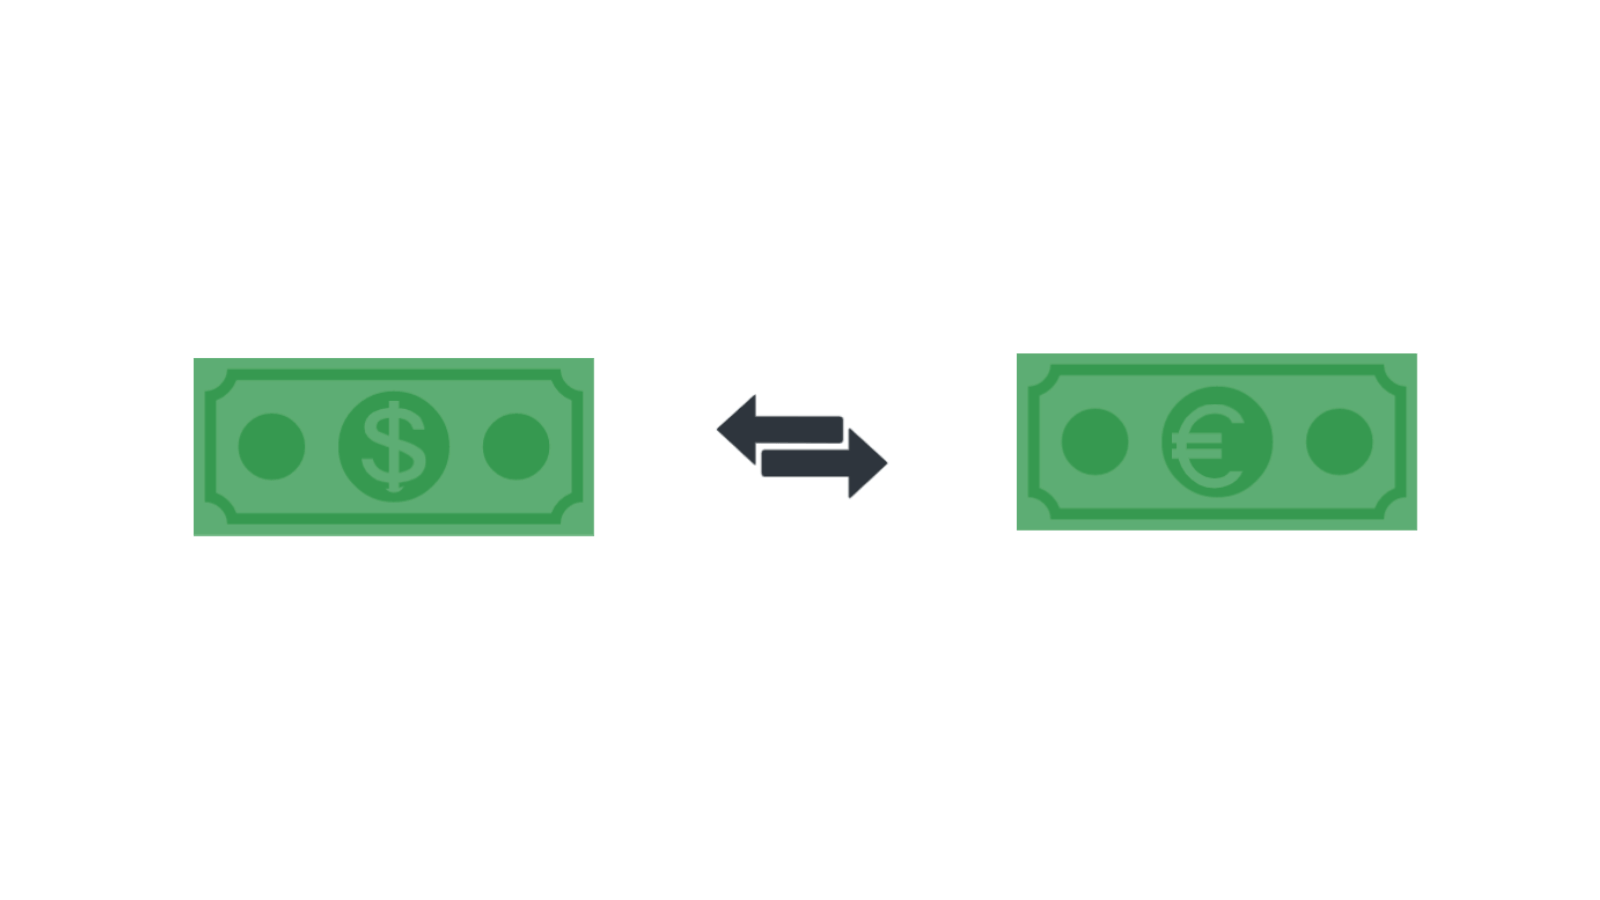
Base and Quote Currency
The first currency of the pair is the base. Its value always equals 1. The second currency of the pair is called the quote. Its price is expressed in the amount of the second currency needed to exchange for one unit of the base.
Points (Pips)
In future lessons, we will often use a concept known as a point (or pip). A point is a measure of price movement. The exchange rate between the euro and the dollar (EUR/USD) can be represented as the number 1.27. Here, only 2 digits are shown after the decimal point. But on the Forex market, the rate is presented more precisely, and in this case, the cost will be displayed as 1.2700. The last digit (0) is the point (pip). If the price of the pair changes from 1.2700 to 1.2701, it means that the price has changed by 1 point (pip). Traders often measure profit in points. For example, a trader buys the EUR/USD pair at a price of 1.2700 and the price rises to 1.2730. This means that the price has increased by 30 points, or the trade has made a profit of 30 points (if closed at this price). 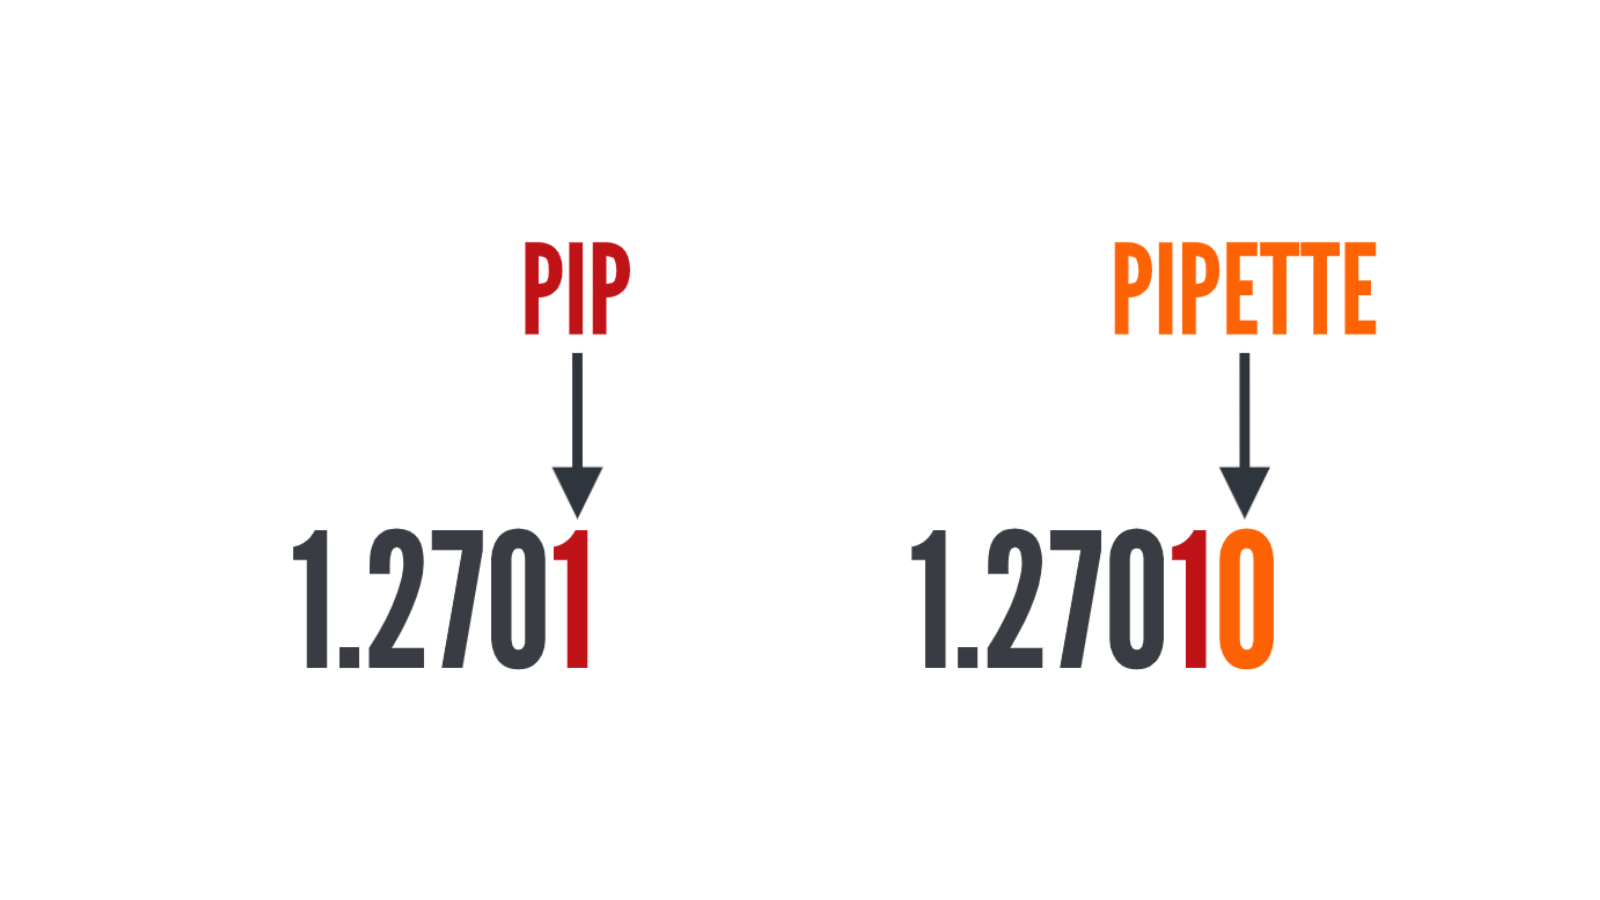
Japanese Yen – An Exception
Currency pairs with the Japanese yen differ from other pairs. Here, the yen has a low value relative to the other major pairs. Therefore, in such pairs, the point is the second digit after the decimal point. If the exchange rate of the USD/JPY pair equals 81.035, then here the point will be the number 3, and the pipette is the number 5.
A Note on Spreads
To better understand the term “spread,” it should be perceived as a commission fee that you must pay to the broker for conducting trading operations. If a pair has a certain price, for example, the price of AUD/USD is 0.8000, you will not buy the currency pair from the broker at this price. The broker will set a higher price (for example, 0.8002). If you plan to open a sell trade, the broker will not buy the AUD/USD pair from you at a price of 0.8000, but at 0.7998. Between the price of 0.8003 and 0.7998, there is a difference of 4 points. This difference is called a spread. Therefore, a spread is the difference between the price at which a broker acquires an asset and the price at which he sells that asset. The broker makes money by buying assets at a lower cost and selling at a higher one. 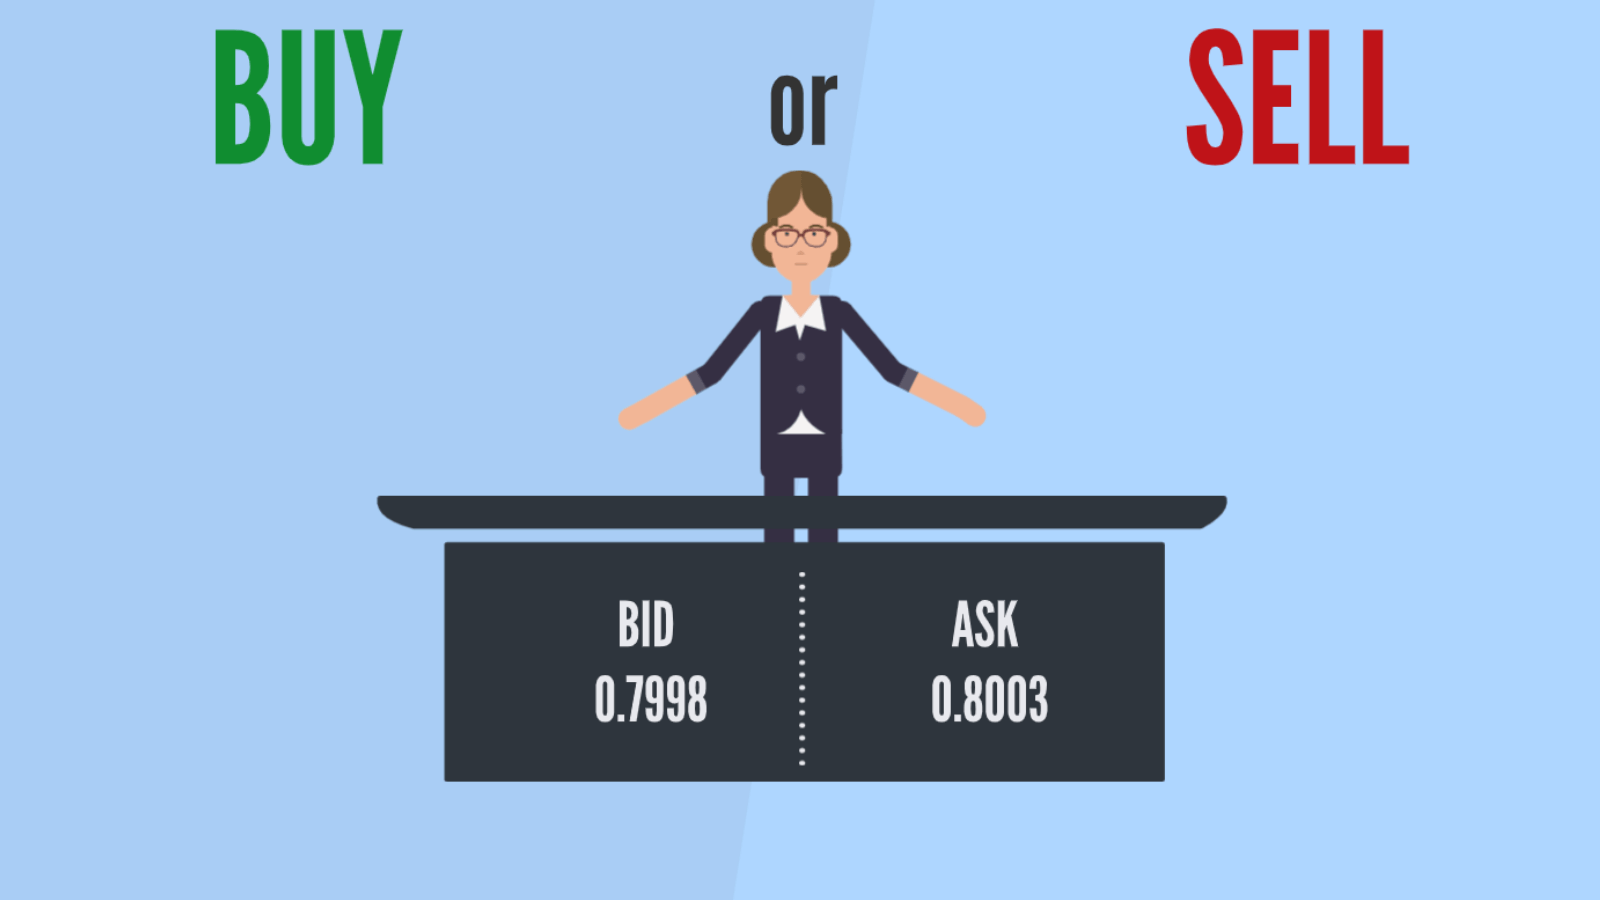
Bid and Ask Prices
The bid price is the most favorable price at which a trader can buy a financial instrument at a particular time. In the Forex market, the bid price is the highest price the broker pays during the purchase of the instrument. The ask price is the most favorable price at which a trader can sell a financial instrument at a particular time. In trading, the ask price is the lowest price at which the broker will sell you the instrument.
Charts Display Price Change Over Time
Japanese Candlestick Charts
Trades are Opened on the Trading Platform
- What you wish to sell or buy;
- The quantity you wish to sell or buy the chosen instrument;
- When you plan to take profit, if the price moves in your favor;
- When you plan to close the deal at a loss, if it turns out to be unprofitable.
Brokers can use various software as platforms. In the screenshot above, the MetaTrader 4 program is depicted, which, despite being somewhat outdated, still remains popular. In the picture, you see the order window. In this window, the trader enters all the information described above. Many trading platforms offer roughly the same features, and price charts are presented in the same way as in the screenshot above.
Trading Instrument (Financial Instrument, Asset)
The trading instrument is the subject of the deal. For example, when buying or selling oil, it is the instrument. In the case of selling or buying the GBP/USD pair, this pair acts as the instrument. Instruments are also often referred to as assets.
Opening and Closing Positions
When you make a deal to sell or buy an instrument, you open a position. Therefore, buying or selling is sometimes referred to as opening a position. In addition, this process is called entering the market. When a trader leaves the market, they are said to close a position.
Stop-Loss Protects the Account

Target Level of the Deal
The target level of the deal is the cost at which you decided to exit the market, having fixed a certain profit. Usually, a trader determines the target level of the deal before they open a position. This means that the trader determines the amount of profit (if the price moves in their favor) before opening the deal.
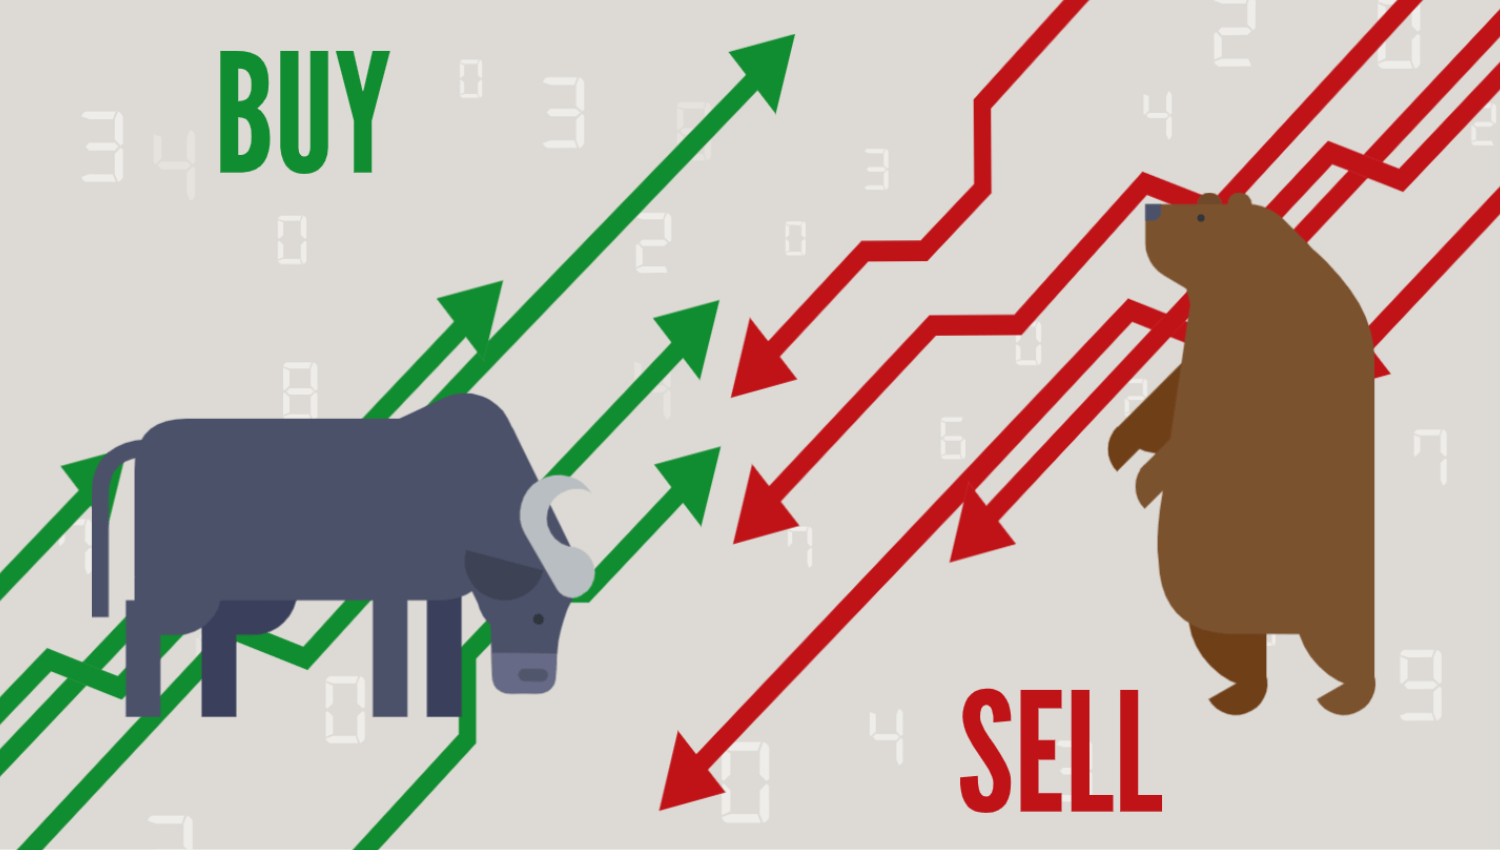
Bears and Bulls
Long Position
We expect growth when we talk about a long position. A “long position” refers to opening a buying deal. Traders often say: “I am in a long position” or “I am opening a long position”. This means that the trader has opened or plans to open a buying position. For example, in Forex market trading, it is said that the trader opens a long position (when buying an asset) if they believe the EUR/USD pair will rise.
Short Position
It’s easy to understand why users open long positions in trading. To open such positions, you need to click the “buy” button. The price will go down or up. If the price goes up, you will be able to make money. If it goes down – you will lose money. 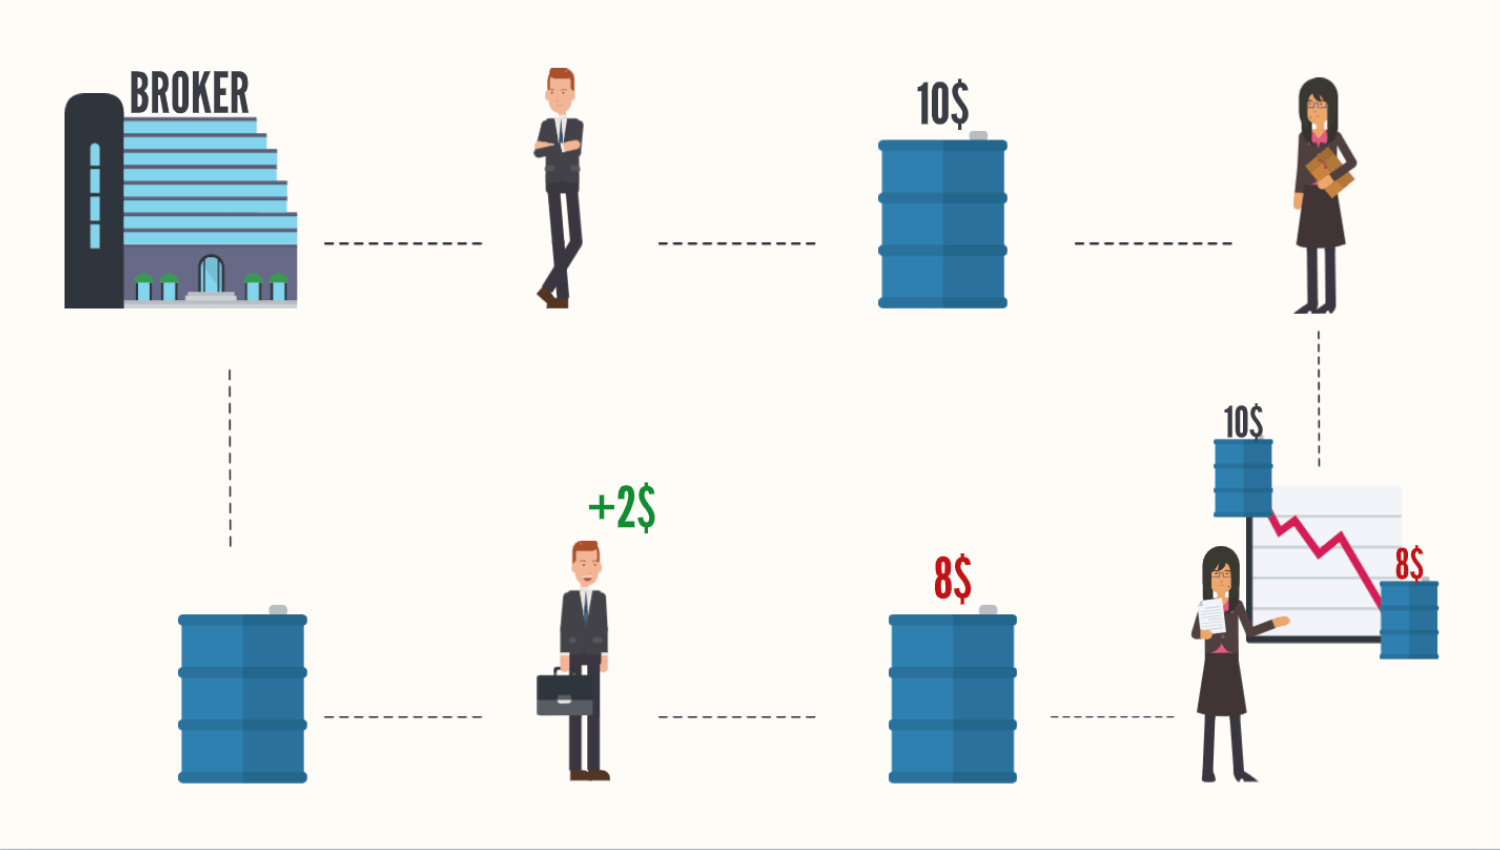
Short Currency Sale
Short currency sale is different from short selling on the stock market. Currencies are always traded in pairs. One currency is bought for another. For example, if you open a long position on the EUR/USD pair, you sell dollars and buy euros. When opening a short position, you sell euros and buy dollars. This is the sale of the EUR/USD financial instrument. This can be explained in other words. When opening a short position on the EUR/USD asset, you acquire the USD/EUR instrument.
Risk / Reward Ratio
This ratio equals the ratio of the amount of money you risk in a certain deal to the amount of potential profit you will get if you correctly determine the currency rate change. For example, if you risk $10, this amount will be the loss you are willing to bear. You will know how much you risk if the price does not go your way. Therefore, you will not lose more than $10. If, according to the forecast, the deal can bring $30, then $30 will be your potential profit. In this case, the risk-to-profit ratio will be 1:3, as you risk $10 and hope to get $30.
